We are pleased to announce that Bob Leaper has been invited to Chair the Performance Measurement, Attribution and Investment Risk track at TSAM NYC on June 18, 2015. The goal of this track it for performance measurement professionals to deepen their network of peers in investment management. It is a truly neutral, unbiased platform, where the buy-side’s leading practitioners determine the agenda and deliver the program. TSAM itself is the leading event for developing efficient investment management companies, with additional tracks covering Data Management, Technology and Operations, Client Reporting and Communications, and Marketing & Sales communications. FInd out more at http://www.tsam.net/newyork.
|
0 Comments
We are please to announce that Bob Leaper has been invited to moderate a panel discussion at FTF's SecOps USA conference on June 1-2, 2015. The panel will be on IT Operations: Transitioning from Legacy to New Systems. The panelists will be Timothy Brodeur from Neuberger Berman, and Kristin Soule from Boston Advisors. The session will focus on the operational impact and lessons learned of adopting new technologies while keeping the business running. Find more information at http://www.ftfnews.com/event/sec-ops-2015/#.VVtTGPlViko.
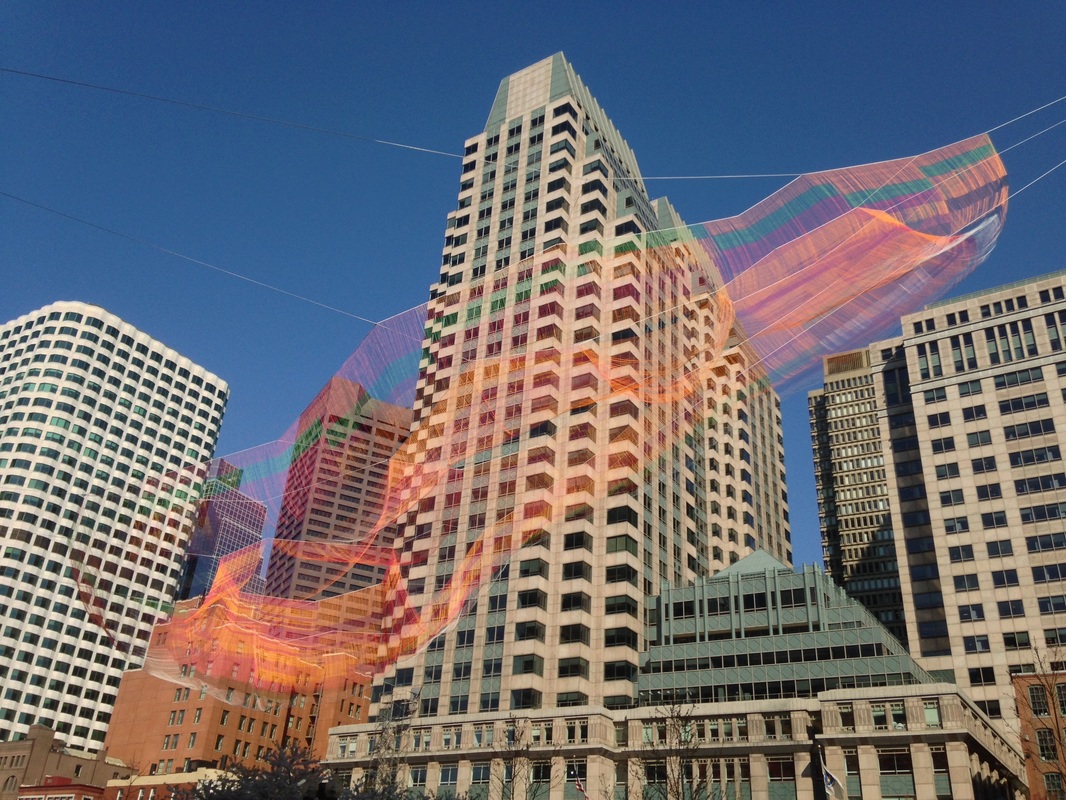
Walking to work in Boston’s Innovation District this morning, it was hard not to notice artist Janet Echelman’s new art installation suspended over the Rose Kennedy Greenway in the middle of the Financial District. Approaching, heading east into the morning sun, it is impressive -- a huge net suspended between buildings -- but didn’t really resonate. After walking along the Greenway and looking back at the installation with the morning sun directly on it, the installation became a resplendent web of orange, green and red, floating in the midst of the stone and steel towers of downtown.
What does this have to do with data? In many ways, data is a mix of components, architecture, science and art. Like the towers and the Greenway itself, architecture is how the components of data are planned, integrated and used on a day to day basis. The science is reflective of using new techniques and tools to construct new connections of information, and the art is what makes new insights come alive in the bright sunlight. Every firm deals with the components of data, one way or another. Examples include using multiple applications with similar, but different, sources and perhaps integrating the results in Excel. More advanced organizations have an architecture in place to increase efficiency and accuracy of this data, from centralized reference data stores to data warehouses and data marts, they know the importance of controlling the structured information and providing data governance to ensure transparency. Cutting edge firms are using Data Science and, yes, art to look at their internal business processes and interaction with the external world to shed new light and creativity on how to better compete. The current generation of business intelligence tools are the sketch pads, paint and easels of this data art movement, but even these tools need architecture and science to really make it come alive. |
AuthorBob Leaper is passionate about advances in technology and new business models. Archives
November 2015
Categories |

 RSS Feed